Some RTA plots for OT15

EQ guys are using on their cabs/systems. A good starting place if you don't have your own RTA.
Message
Author
Strapping Young Stu
Posts: 1016
Joined: Sat Dec 30, 2006 7:01 pm
Location: Dorset, UK

Some RTA plots for OT15

#1 Post by Strapping Young Stu »

Here are a couple of plots of my new OT15s with no processing.

Woofer is a Kappalite 3015, Comp driver is the BMS Neo 1" on a P. Audio Horn.

Unfortunately I don't know the full measurement circumstances because it wasn't me that measured them.

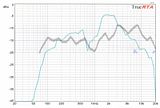
First image is an average plot with an overlay of Bills original plots from the product page to show the similarities and discrepancies of the two sets of measurements.

Image

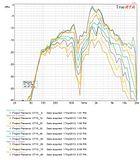
Second image is a plot at various angles, to show how the response drops off - of particular note is the trough at 700Hz. What I do know is that after noticing this trough a different cab was tried to make sure it wasn't just a reflection and the other cab confirmed this.

Image

Enjoy.

Stu

Monomer
Posts: 989
Joined: Mon May 22, 2006 2:55 pm
Location: Metro-Detroit, MI

Re: Some RTA plots for OT15

#2 Post by Monomer »

Pretty jagged curve, I thought it was a lot flatter past 100.


seems the driver can't keep up with the compression driver either, lot of eq needed to tame that.
-AutoTuba; Tang Band 8 inch (x1)
-T39; KappliteLF, 22 wide (x2)
-More to come!

Tsloms
Posts: 60
Joined: Mon Nov 09, 2009 9:10 am
Location: Wisconsin

Re: Some RTA plots for OT15

#3 Post by Tsloms »

Which BMS CD are you using with this horn?

What do you plan on using this combination for? I was thinking about using a BMS 4550 or 4552 on a QSC HPR152 horn with either the OT12 or OT 15 for home usage.

User avatar
Bill Fitzmaurice
Site Admin
Posts: 28916
Joined: Tue May 02, 2006 5:59 pm

Re: Some RTA plots for OT15

#4 Post by Bill Fitzmaurice »

From what I see it appears the woofer wasn't measured ground plane, and of course whatever's going on above 1.5kHz is the product of the BMS driver and Paudio horn.

Strapping Young Stu
Posts: 1016
Joined: Sat Dec 30, 2006 7:01 pm
Location: Dorset, UK

Re: Some RTA plots for OT15

#5 Post by Strapping Young Stu »

That may well have been the case Bill, but since these boxes will never reside on the ground the chart (if it isn't measured on the ground) is accurate for the application as has been very useful for EQ'ing.

I have just spent a couple of hours working with the PEQ in my DEQ2496 to get pretty much the inverse of the chart, and then started to superimpose a F.M. curve over the top.

Initial impressions are very very good indeed, this is a great driver combination. I knew the BMS driver (4552ND) was going to outrun the woofer by a very long way, as its one of the most efficient drivers available for the money (112dB/1W approx) so without EQ "OUCH!".

However once EQ'd its stunning, and thats just from a quick bit of tinkering and lots of listening. If anyone has a good idea of a suitable F.M. curve you think I should be using as a template let me know but for now I am very happy indeed.

Stu

User avatar
Bill Fitzmaurice
Site Admin
Posts: 28916
Joined: Tue May 02, 2006 5:59 pm

Re: Some RTA plots for OT15

#6 Post by Bill Fitzmaurice »

Strapping Young Stu wrote:That may well have been the case Bill, but since these boxes will never reside on the ground the chart (if it isn't measured on the ground) is accurate for the application as has been very useful for EQ'ing.

Stu
And that's why you can't only use charts for making definitive judgements. All charts are measured half-space so that when you compare Chart A and Chart B you're comparing apples with apples. The problem with tops is that they're almost never used in half-space, and not in anechoic rooms either.

The huge bump around 1.5kHz is the result of the very high sensitivity of the BMS, while the severe roll off above that 'plateau' is typical of CD horns, which trade off flat axial response for wide dispersion. The 700Hz notch on the woofer is typical of all woofer horns; the good news is that notches that narrow tend to be inaudible.
And as you note what matters in the end is how it sounds when EQ'd. BTW, you can't even find raw sensitivity charts anymore on high end PA cabs that must be used with DSP. One reason is that when EQ'd they're flat anyway. The other is that they don't want potential buyers to be shocked to see how they run pre-EQ.

Strapping Young Stu
Posts: 1016
Joined: Sat Dec 30, 2006 7:01 pm
Location: Dorset, UK

Re: Some RTA plots for OT15

#7 Post by Strapping Young Stu »

Bill Fitzmaurice wrote:The problem with tops is that they're almost never used in half-space, and not in anechoic rooms either.
Which therefore means that for usefulness in EQing (the point of this post for OT15 users) this chart may well prove better overall than a chart measured in half space.
Bill Fitzmaurice wrote: The huge bump around 1.5kHz is the result of the very high sensitivity of the BMS, while the severe roll off above that 'plateau' is typical of CD horns, which trade off flat axial response for wide dispersion.
I don't think the HF range of this chart will prove that useful to most OT15 users, as depending on the horn, you will get many different results even if the driver stays the same. FWIW the horn I am using if others end up with the exact same setup is the P. Audio PH-220 which has 90x75 dispersion.
Bill Fitzmaurice wrote: The 700Hz notch on the woofer is typical of all woofer horns; the good news is that notches that narrow tend to be inaudible.
Fairly. I have used a PEQ band on the DEQ2496 to fill in the gap - around 7dB fairly narrow band boost, and you can hear a small difference with and without. Definitely sounds better with rather than without.
Bill Fitzmaurice wrote:
And as you note what matters in the end is how it sounds when EQ'd. BTW, you can't even find raw sensitivity charts anymore on high end PA cabs that must be used with DSP. One reason is that when EQ'd they're flat anyway. The other is that they don't want potential buyers to be shocked to see how they run pre-EQ.
What I would hope is that this chart can work as a slightly more detailed starting point for EQing the woofer section of the OT15 than the rather small chart provided on the product page/SPL charts. I am particularly grateful for having the RTA done to this level of detail because it has allowed me to do some very fine tuning to make the cabs as good as they can be. The 10 bands of Parametric EQ in the DEQ2496 are very useful, I highly recommend it if you want to go into minute detail with your EQ.

Stu

User avatar
Bill Fitzmaurice
Site Admin
Posts: 28916
Joined: Tue May 02, 2006 5:59 pm

Re: Some RTA plots for OT15

#8 Post by Bill Fitzmaurice »

Strapping Young Stu wrote:
What I would hope is that this chart can work as a slightly more detailed starting point for EQing the woofer section of the OT15 than the rather small chart provided on the product page/SPL charts.
That's the entire point of this forum section. The charts in the catalog and SPL sections are half-space anechoic, for the purpose of comparison with commercial cabs. This forum section is for in-use charting.

WB
Posts: 1745
Joined: Sat May 13, 2006 3:06 pm
Location: Ontario. Yours To Discover

Re: Some RTA plots for OT15

#9 Post by WB »

Strapping Young Stu wrote:
I am particularly grateful for having the RTA done to this level of detail because it has allowed me to do some very fine tuning to make the cabs as good as they can be. The 10 bands of Parametric EQ in the DEQ2496 are very useful, I highly recommend it if you want to go into minute detail with your EQ.

Stu
Are you adjusting the parametric parameters based on your interpretation of the plot, or are you doing it in real time with the analyzer?
Tomorrow I'm going to stop procrastinating - WB

Strapping Young Stu
Posts: 1016
Joined: Sat Dec 30, 2006 7:01 pm
Location: Dorset, UK

Re: Some RTA plots for OT15

#10 Post by Strapping Young Stu »

Based on interpretation of the plot for now as I don't have the facilities to do RTA to the level of ones already done easily.

At some stage I hope to get them out in the garden and plug my Mac in which would give me some analysis potential but thats probably not going to be for a while.

Stu

moo
Posts: 134
Joined: Thu Jan 31, 2008 11:38 am
Location: Dorset UK

Re: Some RTA plots for OT15

#11 Post by moo »

Bill Fitzmaurice wrote:From what I see it appears the woofer wasn't measured ground plane, and of course whatever's going on above 1.5kHz is the product of the BMS driver and Paudio horn.
The cab was measured on the ground, with the mic 1 meter from the centre of the front of the cab. Mic was 1/2" above the ground above a 2 ft square sheet of plywood. The angled measurements are increments of 10 degrees, with the mic 1 meter from the centre of the front face of the cab. The RTA resolution was 1/6th octave (64 band).

To verify that the null in the OT15s response was not an environmental anomaly, I measured my direct radiator monitor cabs during the same session.
None of the others cabs showed the same null. - (Except my DR200 but at a different frequency.)
I have seen polar plots with a similar null somewhere between 500-1000hz in other commercial horn loaded cabs (EV). I have been told on another forum that this is an acoustic phase cancellation issue common in mid horns. The frequency at which it occurs is directly proportional to the width of the cab, but I have to confess I cannot remember the theory of what causes it.

I have measured cabs on poles before at different distances. You always get a couple of peaks and troughs between 100-1000hz due to phase cancellations of the waves reflected from the ground. The frequencies vary depending on the measuring distance, so for the purposes of getting a general eq in a venue they are best ignored. (unless your audience is only 1 row deep in a perfect circle around the cab!)

I have noticed that Bills plot shows deeper bass response than mine. What driver was in the OT15 you measured Bill?
The woofer had not been 'run in' at the time of testing, and will doubtless perform better in the low end after a few dozen hours of use.
Mark.
I live the smell of birch ply in the mornings... Smells like... Victory!
User avatar
Bill Fitzmaurice
Site Admin
Posts: 28916
Joined: Tue May 02, 2006 5:59 pm

Re: Some RTA plots for OT15

#12 Post by Bill Fitzmaurice »

moo wrote:
I have noticed that Bills plot shows deeper bass response than mine. What driver was in the OT15 you measured Bill?
A 2515, with 6 months of use.

WB
Posts: 1745
Joined: Sat May 13, 2006 3:06 pm
Location: Ontario. Yours To Discover

Re: Some RTA plots for OT15

#13 Post by WB »

Strapping Young Stu wrote:Based on interpretation of the plot for now as I don't have the facilities to do RTA to the level of ones already done easily.
I thought so, but didn't want to assume.

I think it's possible to make an improvement by guessing the parameters for a major dip or peak, but don't think it's really possible to use many parametric (certainly not ten) EQ's just by plot interpretation. I have more than one DEQ so was able to play pink noise thru one and use the other to analyze and found the interactions between bands made for unpredictable results without seeing the results in realtime. I found the 31 band graphic EQ even more unpredictable without visual feedback. Since you have the DEQ, why not take it outside and do an AutoEQ?
moo wrote: have measured cabs on poles before at different distances. You always get a couple of peaks and troughs between 100-1000hz due to phase cancellations of the waves reflected from the ground. The frequencies vary depending on the measuring distance, so for the purposes of getting a general eq in a venue they are best ignored.
I've seen that as well. I like to get the cab up high off the ground and the mic in close (relative to the cab to ground distance).
Tomorrow I'm going to stop procrastinating - WB

moo
Posts: 134
Joined: Thu Jan 31, 2008 11:38 am
Location: Dorset UK

Re: Some RTA plots for OT15

#14 Post by moo »

Strapping Young Stu wrote: If anyone has a good idea of a suitable F.M. curve you think I should be using as a template let me know but for now I am very happy indeed.
Stu
An FM curve will involve quite a lot of boost in the bottom end, and / or even more cutting in the mid highs on top of what you already need for the CD horn.
To stay within the excursion limits of the woofer, the cab will be working at a fraction of its full capabilities in the mid & HF. It would be best to run with subs if you want to use FM curves.

Mark.
I live the smell of birch ply in the mornings... Smells like... Victory!

Strapping Young Stu
Posts: 1016
Joined: Sat Dec 30, 2006 7:01 pm
Location: Dorset, UK

Re: Some RTA plots for OT15

#15 Post by Strapping Young Stu »

WB wrote:
I think it's possible to make an improvement by guessing the parameters for a major dip or peak, but don't think it's really possible to use many parametric (certainly not ten) EQ's just by plot interpretation. I have more than one DEQ so was able to play pink noise thru one and use the other to analyze and found the interactions between bands made for unpredictable results without seeing the results in realtime. I found the 31 band graphic EQ even more unpredictable without visual feedback. Since you have the DEQ, why not take it outside and do an AutoEQ?
This is certainly an option, however the Auto EQ works only from the GEQ section AFAIK, and therefore will not give me accurate frequency/bandwidth EQ, just "general". In addition, I can overlay one parametric band over another to perform the 2 functions I want (1-getting EQ flat then 2-superimposing F.M. curve over this) then switch these bands on or off to compare with and without, rather than trying to do a "compound" curve using the GEQ which is what i tried to do first and it sounds worse than just sticking with the Parametric TBH.

With regards to Marks comment about FM in the bass end, I should have been clearer, I am not going to extend the F.M. curve into the bass response, just use the general points to help make the midrange as sweet as possible.

Stu

Post Reply